As a web developer, the ability to benchmark your site’s speed and identify performance bottlenecks/issues is a super valuable skill. Luckily, with the abundance of performance testing tools now available, it’s easier than ever before to run a performance scan on your site and glean useful insight into improvements that can be made.
In this tutorial, we’ll cover a few of the most popular Performance Testing tools available to web developers- as well as share a few useful resources for further study.
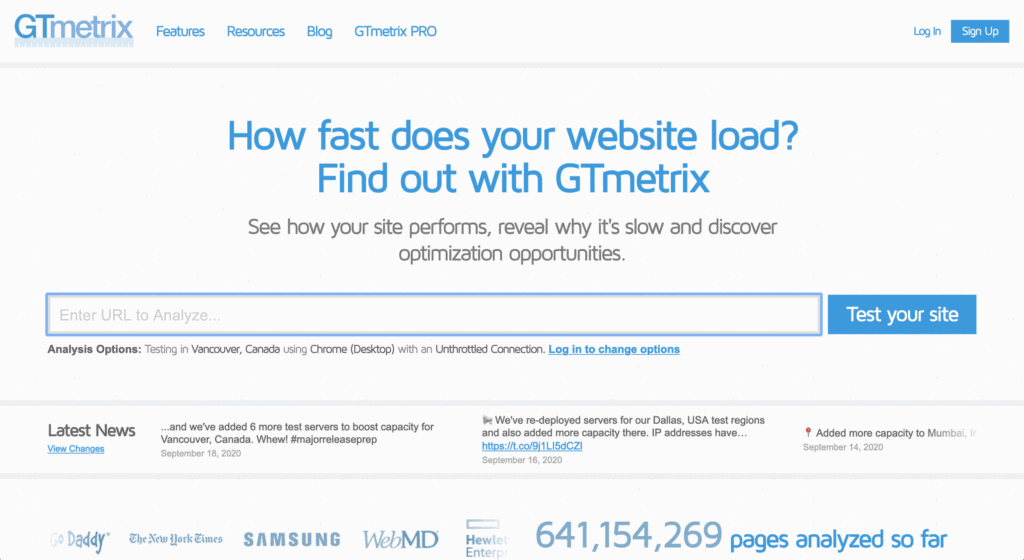
1) GTMetrix
GTMetrix is one of the most popular performance testing tools available on the internet. This free tool provides insight into your website’s overall performance, and as of October 2020, now uses the Google Lighthouse framework.

ToolKit currently uses GTMetrix as our performance scanner of choice because it allows our users to not only perform scans and export PDF reports, but also allows our users to track historical site performance.
As soon as GTMetrix makes their new API public, we will also be upgrading Booster’s Performance Audits over to Google’s Lighthouse API as well.
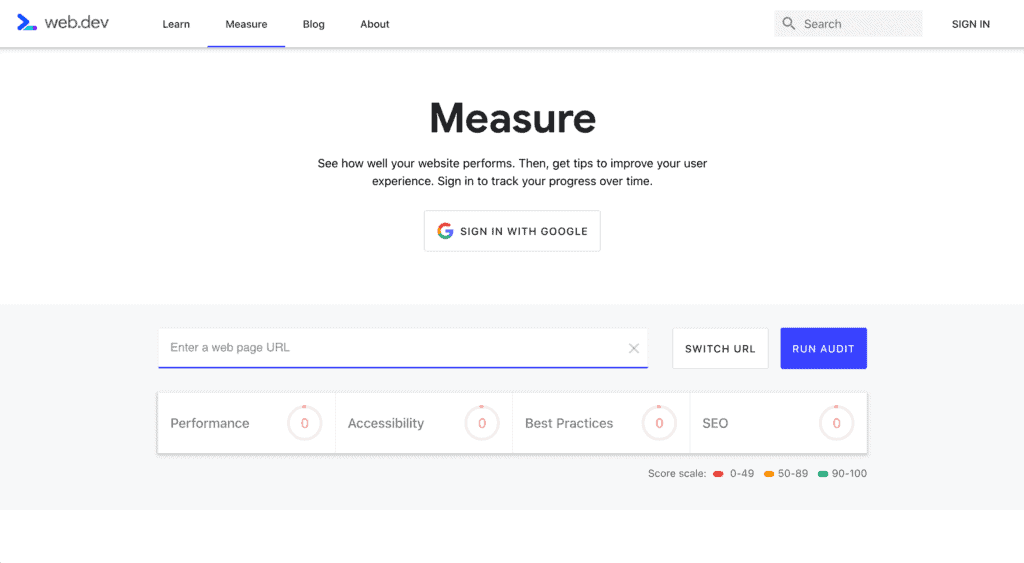
2) web.dev – Google Lighthouse
Google’s Lighthouse framework is an open-source tool for improving the quality and performance of web pages. It has audits for performance, accessibility, progressive web apps, SEO and more.

Over the past several years, the Lighthouse framework as really evolved and polished to a point where it is quickly becoming the preferred tool of choice by web professionals and cloud services when it come to website benchmarking.
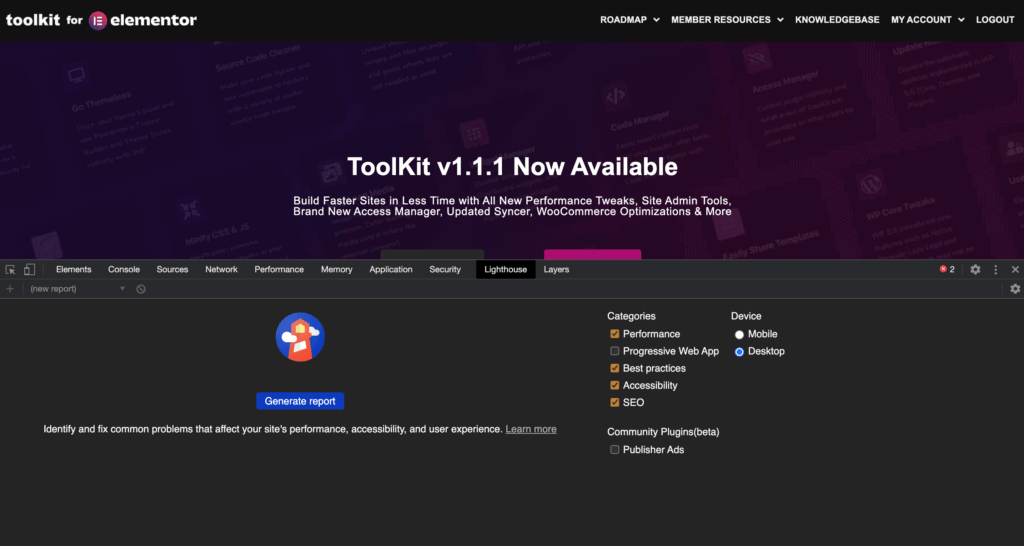
To run a performance audit using the Lighthouse framework, users can either visit web.dev or run a test within the Chrome Browser directly in Chrome’s DevTools.
From the Chrome main menu , choose More Tools, then Developer Tools (Windows: Ctrl + Shift + I / Mac: Command + Alt + I), and then click the Audits or Lighthouse tab and run a scan.

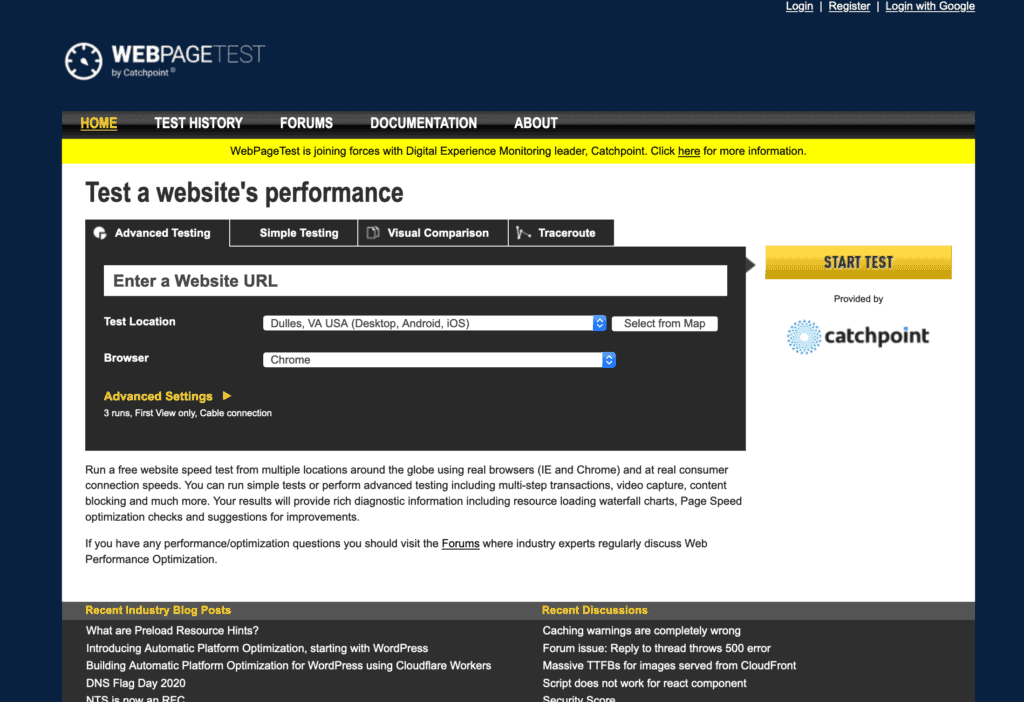
3) WebPageTest.org
Another crowd favorite, WebPageTest.org is a free service similar to GTMetrix that allows you to analyze your site’s performance metrics. WPT has more locations to test from compared to WPT as well as the ability to perform consecutive tests to get an average load time for your site.

3) Pingdom.com
Pingdom.com is another super useful performance benchmarking tool used by many developers. There is both a free and paid service that offers additional testing locations that some of the other testing tools don’t have. One cool aspect of Pingdom’s testing tools is a convenient breakdown of your site’s Content Types

All of the tools above have their pros and cons, but when used together do a great job of painting the overall performance picture for a website.
Ultimately, remember that scores are not the same as load times. It is possible to have a great performance score, but a slow load time. It is also possible to have a bad performance score, but a fast load time.
While it is tempting (and addicting) to begin optimizing sites for speed, remember to also keep your users’ experience, site content quality, and other factors in mind.
Want to learn some performance basics and a few tricks on how to speed up those Elementor sites? Check out these resources:
How to Speed Up Elementor Sites
Ultimate Web Performance Guide
Running a Performance Scan using Booster
Elementor’s Performance Tutorial Part 1
Elementor’s Performance Tutorial Part 2
